Piaget's Theory
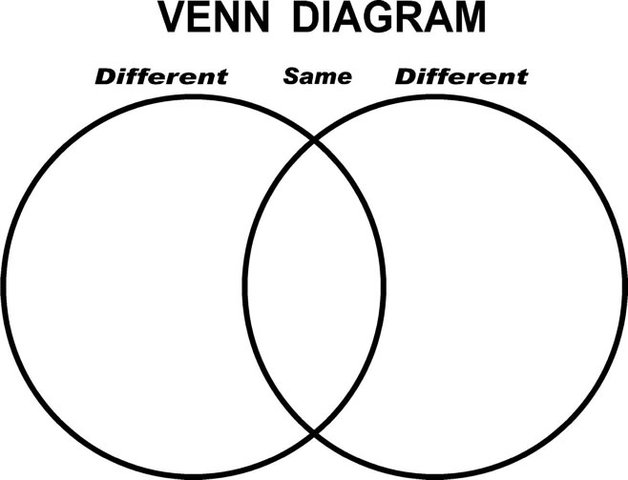
Children in Piaget's concrete operational stage begin to make connections between different concepts. “Presenting information in multiple ways allows concepts to become more meaningful to them” (Schroeder, 1999 – 2014). Graphical representations, such as Venn diagrams when making comparisons and timelines when illustrating historical events, can illustrate ideas.
Curriculum Links
“Props and demonstrations such as spinners, paper folding and blocks can illustrate mathematical concepts” (Schroeder, 1999 – 2014). This enables students to answer questions they may have, but also may raise some more critical questions in regards to concepts they do not yet fully understand. Providing students with graphic organisational strategies to comprehend information enables languages and symbols to be represented and communicating the information, experiences and ideas (Ministry of Education, 2007).
The Venn Diagram can be used in multiple ways for most units in the classroom for example Inquiry, writing, reading activities, mathematics, P.E, Dance, Drama etc. This is through gathering ideas of similarities and differences about the topic and using this information to question critically about the information gathered providing deeper ideas and encouraging further investigation or research.
Examples Outside Of The Classroom
In regard to this being implemented for students outside of the curriculum, it gives students the ability to have a visual representation in their mind and enables them to visualise graphic organizers such as a Venn diagram when faced with comparison concepts in day-to-day activities.
 Instructional Resource Center (n.d)
Graphic Organiser
